Keywords
Concentration category; Depth; Soil quality; Brackish water pond; Indonesia
Introduction
Indonesian government has established the President of Indonesia Instruction number 7 of 2016 on the acceleration in national fisheries industries. The Ministry of Marine Affairs and Fisheries (MMAF) is expected to increase the fisheries productions through capture and aquaculture fisheries to maintain the availability of raw materials for industry and consumption. At present, there are five aquaculture types developed in Indonesia, which are brackish water ponds, freshwater ponds, mariculture, inland open water, and rice fish. Among those five aquaculture types, brackish water ponds are the biggest aquaculture industry in Indonesia. However, mariculture is the biggest aquaculture fisheries producer that produces 9.04 million tonnes (62.95% of total aquaculture in Indonesia). In contrast, the biggest production value is provided by brackish water ponds which are IDR 42.50 trillion (33.28% of total aquaculture production value) (MMAF, 2015).
The brackish water ponds in Indonesia extend to 657,345.64 ha where most of the area is located in Java Island, which is 176,316.18 ha representing 26.82% of total pond areas in Indonesia. The ponds on Java Island are located in 6 provinces/special region capital city/special region; however, the most extended ponds areas are found in West, Central, and East Java provinces. Ponds in these three provinces mainly utilized for culturing tiger shrimp (Penaeus monodon), whiteleg shrimp (Litopenaeus vannamei), mud crabs (Scylla spp.), milkfish (Chanos chanos), and seaweed (Gracilaria verrucosa) through monoculture and polyculture under extensive, extensive plus, semi-intensive, intensive or super-intensive technologies.
Topography, tides, soil, and water qualities as well as climate are considered in enacting criteria for land suitability for ponds aquaculture, particularly for extensive and semi-intensive technologies; however, soil quality is the most dominant factor in criteria for land suitability for ponds aquaculture (Boyd, 1995; Salam et al., 2003; Giap et al., 2005; Karthik et al., 2005; Hardjowigeno and Widiatmaka, 2011; Mustafa, 2012; Mustafa et al., 2015a). Soil quality has a vital role in the successes and sustainability of ponds aquaculture. Soil quality affects water quality, biological process in ponds, and pond constructions (Sammut, 1999), it also controls transformation of nutrients, particularly performance of fertilizer (Banerjee et al., 2010). Furthermore, soil quality controls stability of pond bottom soils, pond water alkalinity, water pH and concentration of nutrients required by natural feed (Ekubo and Abowei, 2011; Caipang et al., 2012; Kumar et al., 2012; Siddique et al., 2012; Boyd and Queiroz, 2014). Soil quality and pond bottom soil processes as well as the association between ponds soil and water are important for fish or shrimp growth (Avnimelech and Ritvo, 2003; Ndome et al., 2012). The soil processes affect water quality and most problems in ponds aquaculture are associated with soil qualities (Boyd, 1992). To understand soil chemical processes and to establish decisions on land suitability for ponds aquaculture together with effective soil managements to increase ponds productivity, there is a need in understanding pond soil qualities.
The surface sediment of pond has the biggest impact on quality of pond environment, such as water quality. Although water quality management is considered as a crucial factor in the success of ponds, some evidences show that soil quality and the materials exchanges between soil and water affect pond water quality (Boyd, 1995; Siddique et al., 2012). Anaerobic surface pond soil is particularly harmful for cultured shrimp because the shrimp lives on pond soils surface. The direct contact between tiger shrimp and pond bottom soils through aqueous phase is the cause of low survival rate of shrimp cultured in sulfate acid soil-affected ponds (Mustafa, 2007). However, deeper soil characteristics need be measured because the pond soil is sometimes excavated during pond establishment and management either to meet pond depth requirement or to have a new pond soil surface that has different quality. The new established pond areas are usually cleared from vegetation and about 0.25 to 0.75 m of surface soils are usually removed to establish pond dykes (Boyd and Queiroz, 2014). The characteristics of soil may various following the differences of soil depths (Boyd, 1976; Mustafa et al., 2015b; Perryman et al., 2017). The surface soils usually have different characteristics to the deeper soils (Sartohadi et al., 2012).
A “tool” in aquaculture management that rarely utilized and developed is soil analysis. Data of pond soil quality collected through soil analyses are scarcely applied by most decision makers, including aquaculture managers; however low soil quality is frequently the suspect when they cannot explain low growth and survival rate of cultured organism resulted by diseases outbreaks, low feed quality, extreme season, low water quality, incorrect pond management or other main causes. Information on category of concentration soil quality variables is a crucial aspect in understanding the status of pond soil quality. The category of concentration soil quality variables had been established in ponds of Thailand, Philippines, Ecuador, and Venezuela (Boyd et al., 1994); however, these categories were based on limited soil quality variables. Mustafa et al. (2015a) also have established category of concentration soil quality variables in pond soils in South Sulawesi where the soils is swamp land consisted of alluvial acid sulfate, peat and alluvial non-acid sulfate soils, including saline soil. The soils in Java Island, especially in northern and eastern coasts are dominated by volcanic soil (Supriyo et al., 1992; Jensen, 1993; Devnita et al., 2010; Erfandi and Rachman, 2011; Widiatmaka et al., 2016) that has specific characters; therefore the soils show particular character and different from soils outside Java Island. In addition, some studies conducted in shrimp ponds of Java island only assessed land suitability for shrimp pond (Utojo et al., 2012; Utojo et al., 2013a; Utojo et al., 2013b; Utojo et al., 2013c; Suhaemi et al., 2013; Utojo et al., 2014); spatial distribution of soil variables (Asaad and Mustafa, 2011; Kamariah et al., 2014); influence of water and soil qualities on shrimp production (Mustafa and Athirah, 2014), traditional shrimp pond management (Mustafa et al., 2015c) and feasibility of silvofishery (Tarunamulia et al., 2015). This study was aimed to provide information on categories of soil quality variable concentrations at two different soil depths of pond soils in Java Island. This activity was as the initial categorization to interpret soil quality variables in categorizing soil quality variable concentrations as very low, low, moderate, high, or very high and for making decision in pond soils management.
Materials and Methods
Soil samples
Pond soil samples were collected at the Regencies/Cities of Subang, Indramayu, Cirebon (West Java), Brebes, Pekalongan, Demak, Pati (Central Java), Tuban, Lamongan, Gresik, Sidoarjo, Pasuruan, and Probolinggo (East Java), Indonesia (Figure 1). These areas were selected by the MMAF as the minapolitan and aquaculture revitalization areas based on the Ministry of MMAF decree number KEP.32/MEN/2010 on the determination of minapolitan areas. In addition to the MMAF, the general director of aquaculture issued a degree number Kep.240/DJ-PB/2012 to determination 87 locations of aquaculture production centre as the pilot area for minapolitan. Samples of soils were collected using bore soil sampler with a diameter of 0.05 m. The number of sampling points was 923 points extended in those 13 regencies/ cities where the sampling points were chosen based land use and topography (Rayes 2007; Hazelton and Murphy, 2009). The collections of soil samples were conducted during 2010 to 2015.
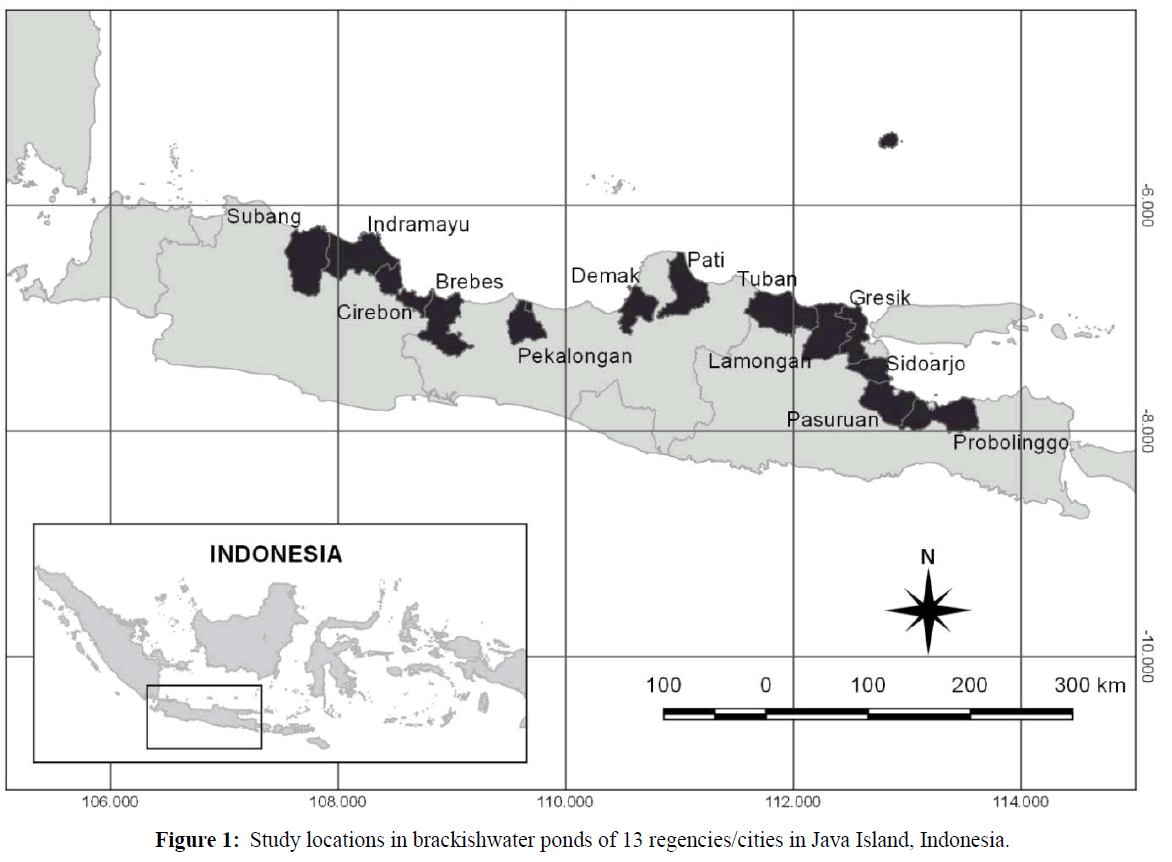
Figure 1: Study locations in brackishwater ponds of 13 regencies/cities in Java Island, Indonesia.
The samples of pond bottom soils were collected at two sampling points of each pond bottom then composited to represent one sampling point. The samples of pond soils were collected at two depths, which were 0-0.2 and 0.2-0.5 m for each sampling point. The sampling activities were mostly conducted at ongoing farming ponds for various fisheries commodities; therefore most samples were collected from watering ponds. The vegetation debris, gravels, shells, and other contaminants attached in the soil samples were removed manually by hands then the samples were filled in plastic bags and stored in ice box (Ahern et al., 2004) and eventually transported to the Soil Laboratory belongs to Research Institute for Coastal Aquaculture and Fisheries Extension, previously known as Research Institute for Coastal Aquaculture.
Soil analyses
pHF of soil samples were measured under in-situ measurements using a pH meter based on electrometric method (Ahern and Rayment, 1998; Watling et al., 2004), whereas and pHFOX (pH of oxidized soils using 30% of hydrogen peroxide (H2O2) of soil samples were measured also using a pH meter based on electrometric method (Ahern and Rayment, 1998; Watling et al., 2004; Hazelton and Murphy, 2009). In the laboratory, the acid sulfate soil samples were dried in an oven under 80-85°C for 48 hours (Ahern and Blunden, 1998). The non-acid sulfate soils samples were air dried in a special and contaminant free rack that was protected from sunlight. The dried samples were then grounded using porcelain mortar and pestle then sieved on a 2.0 mm mesh size. The samples were then re-grounded using porcelain mortar and pestle then re-sieved on a 0.5 mm mesh size to obtain soil particle size less than 0.5 mm.
The soil quality variables analyses in the laboratory consisted of pHH2O (pH of soils extracted by H2O), pHKCl (pH of soils extracted by KCl), pHOX (pH of soils extracted by 30% of H2O2) based on electrometric method (McElnea and Ahern, 2004a,b), Sp (sulphur extracted by 30% of H2O2) based on spectrophotometric method (McElnea and Ahern, 2004c), SKCl (sulphur extracted by KCl) based on spectrophotometric method (McElnea and Ahern, 2004c), SPOS (Sp–SKCl) (McElnea and Ahern, 2004d), Titratable Peroxide Acidity (TPA), previously known as Total Potential Acidity based on titrimetric method (McElnea and Ahern, 2004b), Titratable Actal Acidity (TAA), previously known as Total Actual Acidity based on titrimetric method (McElnea and Ahern, 2004a), Titratable Sulfidic Acidity (TSA), also known as Total Sulfidic Acidity) (TPA-TAA) (McElnea and Ahern, 2004b), pyrite (FeS2) through titrimetric method (Ahern et al., 1998a, b), organic carbon by titrimetric under method of Walkley and Black (Sulaeman et al., 2005; Eviati and Sulaeman, 2009), total Nitrogen by titrimetric using Kjedhal method (Sulaeman et al., 2005; Eviati and Sulaeman, 2009), PO4 and P2O5 measured using titrimetric under Bray or Olsen method (Sulaeman et al., 2005; Eviati and Sulaeman, 2009), Iron (Fe) and aluminium (Al) using spectrophotometric technique (Menon, 1973) through a GENESYS 10S UV-Vis spectrophotometer.
Quality control by a duplo measurement and controled sample (Kantasubrata, 2012) was applied on selected soil quality variables and soil samples. Re-analyses on the selected variables and soil samples were conducted during field works; whereas controlled samples were conducted on soil quality variables analysed in the laboratory as a part of the laboratory quality control.
Data analyses
Data of this study were then compiled from studies collecting data of soil quality variables through the studied area, Subang Regency (Tarunamulia et al., 2015), Indramayu Regency (Utojo et al., 2013b), Brebes Regency (Suhaemi et al., 2013), Pekalongan (Asaad and Mustafa, 2011), Demak Regency (Mustafa and Athirah, 2014), Pati Regency (Mustafa et al., 2015c), Tuban Regency (Utojo et al., 2014), Lamongan Regency by Utojo et al., 2012), Gresik Regency (Utojo et al., 2013a), Pasuruan Regency (Utojo et al., 2013c), and Regency and City of Probolinggo (Kamariah et al., 2014).
Data analyses were initialed by determining outlier data of each soil quality variable using standard score (Z-Score). Levene’s test was conducted to measure the equality of variance of a variable in two data populations (0-0.2 and 0.2-0.5 m depths). Data of pHH2O, pHOX, organic C, organic matter, TPA, TSA, Pyrite, SKCl, SP, SPOS, Fe, and Al were directly analyzed using t-Student test as these data meet the requirement for parametrical analysis; whereas data of redox were transformed by log10 (X+3); C:N ratios, PO4, and P2O5 were transformed by log10 (X+1) prior to t-Student tests since the variance of these data were not equal. In contrast, data of pHF, pHFOX, pHF-pHFOX, pHKCl, total N, and TAA did not meet requirement for parametrical analyses then analyzed using non-parametric analyses by Mann-Whitney (U-tests). The acceptance degree for each statistical analyses were 95% (α=0.05). The quantitative measurements on soil quality variables were presented as average ± standard deviation. The deciles measurements were conducted by re-arranging the data from the lowest to the highest. The deciles of soil quality variables then categorized in to five concentration categorizes, which were: very low (1st decile), low (2nd and 3rd deciles), moderate (4th to 7th deciles), high (8th and 9th deciles), and very high (10th decile) based on Boyd et al. (1994). Data analyses were conducted using IBM® SPSS® (Statistical Product and Service Solution) software, version 24.
Results and Discussion
Volcanic soils are also known as andosols or andisols on a various soil classification systems (Hardjowigeno, 2003). Most of volcanic soils in Indonesia distributed on Sumatera, Java, Bali, and Lombok Islands. Van Ranst et al. (2002) reported that Java has a various types of soils, yet dominated by volcanic soils. Volcanic soils were formed through a weathering of volcanic dusts; this soil type is also distributed to the low land of Java by wind transport. However, alluvial, which are acid sulfate soils and non-acid sulfate soils also found on pond soils in a small specific area of Java Island (Asaad and Mustafa, 2011; Mustafa and Athirah, 2014; Mustafa et al., 2015c). The characteristics of pond soils at two different depths are presented on Tables 1-3.
| Variables |
Depths (m) |
| 0-0.2 |
0.2-0.5 |
| pHF |
7.22 ± 0.37b |
7.15 ± 0.40a |
| pHFOX |
6.58 ± 1.05a |
6.64 ± 1.19b |
| ∆pH |
0.77 ± 0.74b |
0.58 ± 0.91a |
| pHH2O |
8.00 ± 0.28b |
7.94 ± 0.28a |
| pHKCl |
7.46 ± 0.39b |
7.33 ± 0.59a |
| pHOX |
4.55 ± 1.56a |
4.42 ± 2.08a |
| SKCl (%) |
0.2859 ± 0.2922a |
0.2626 ± 0.2669a |
| SP (%) |
6.1589 ± 8.2845a |
6.5865 ± 8.8647a |
| SPOS (%) |
5.3990 ± 4.5590a |
6.0798 ± 8.7088a |
| TPA (mole H+/t) |
86.55 + 126.76a |
90.43 + 143.50a |
| TAA (mole H+/t) |
0.02 ± 0.19a |
0.06 ± 0.30a |
| TSA (mole H+/t) |
86.53 ± 126.76a |
90.37 ± 143.50a |
| Pyrite (%) |
0.3862 ± 0.5659a |
0.4019 ± 0.6393a |
| Fe (ppm) |
531.64 ± 521.22a |
485.16 ± 502.10a |
| Al (ppm) |
113.56 ± 96.92b |
92.08 ± 88.59a |
| Organic C (%) |
1.4723 ± 0.7528a |
1.4201 ± 0.7811a |
| Total N(%) |
0.0979 ± 0.0558b |
0.0888 ± 0.0508a |
| C:N ratio |
16.16 ± 8.31a |
17.49 ± 8.97b |
| PO4 (ppm) |
62.70 ± 54.15b |
43.57 ± 41.75a |
| P2O5 (ppm) |
46.86 ± 40.47b |
32.56 ± 31.20a |
Table 1: Descriptive statistics of soil quality variables at different depths in brackish water ponds of Java Island, Indonesia.
| Variables |
Decile |
| 1st |
2nd and 3rd |
4th to 7th |
8th and 9th |
10th |
| (Very low) |
(Low) |
(Medium) |
(High) |
(Very high) |
| pHF |
<6.95 |
6.95–<7.20 |
7.20–7.52 |
>7.52–7.64 |
>7.64 |
| pHFOX |
<6.10 |
6.10–<6.61 |
6.61–7.34 |
>7.34–7.72 |
>7.72 |
| ∆pH |
<0.22 |
0.22–<0.44 |
0.44–1.14 |
>1.14–1.70 |
>1.70 |
| pHH2O |
<7.82 |
7.82–<7.96 |
7.96–8.21 |
>8.21–8.31 |
>8.31 |
| pHKCl |
<7.22 |
7.22–<7.47 |
7.47–7.75 |
>7.75–7.84 |
>7.84 |
| pHOX |
<2.71 |
2.71–<3.47 |
3.47–6.54 |
>6.54–7.28 |
>7.28 |
| SKCl (%) |
<0.0300 |
0.0300–<0.1280 |
0.1280–0.5320 |
>0.5320–0.7790 |
>0.7790 |
| SP (%) |
<0.4860 |
0.4860–<0.8740 |
0.8740–16.0500 |
>16.0500–21.9860 |
>21.9860 |
| SPOS (%) |
<0.0100 |
0.0100–<0.5000 |
0.5000–14.8800 |
14.8800–19.7200 |
>19.7200 |
| TPA (mole H+/t) |
<0.01 |
0.01–<2.50 |
2.50–154.60 |
>154.60–310.00 |
>310.00 |
| TAA (mole H+/t) |
0 |
0.00–0.00 |
0.00–0.00 |
0.00–0.00 |
0 |
| TSA (mole H+/t) |
<0.01 |
0.01–<2.50 |
2.50–154.60 |
>154.60–310.00 |
>310.00 |
| Pyrite (%) |
<0.0001 |
0.0001–<0.0100 |
0.0100–0.6900 |
>0.6900–1.3800 |
>1.3800 |
| Fe (ppm) |
<40.00 |
40.00–<225.56 |
225.56–910.00 |
>910.00–1,298.91 |
>1,298.91 |
| Al (ppm) |
<16.50 |
16.50–<76.08 |
76.08–175.80 |
>175.80–253.55 |
>253.55 |
| Organic C (%) |
<0.8400 |
0.8400–<1.2600 |
1.2600–2.0200 |
>2.0200–2.4050 |
>2.4050 |
| Total N(%) |
<0.0600 |
0.0600–<0.0700 |
0.0700–0.1300 |
>0.1300–0.1700 |
>0.1700 |
| C:N ratio |
<8.65 |
8.65–<13.26 |
13.26–22.66 |
>22.66–27.02 |
>27.02 |
| PO4 (ppm) |
<11.86 |
11.86–<36.14 |
36.14–103.05 |
>103.05–139.97 |
>139.97 |
| P2O5 (ppm) |
<8.86 |
8.86–<27.01 |
27.01–77.01 |
>77.01–104.61 |
>104.61 |
Table 2: Categories of brackish water ponds soil quality variables concentrations at the depth of 0-0.2 m of Java Island, Indonesia.
| Variables |
Decile |
1st
(Very low) |
2nd and 3rd
(Low) |
4th to 7th
(Medium) |
8th and 9th
(High) |
10th
(Very high) |
| pHF |
<6.84 |
6.84–<7.14 |
7.14–7.48 |
>7.48–7.60 |
>7.60 |
| pHFOX |
<6.08 |
6.08–<6.70 |
6.70–7.54 |
>7.54–7.82 |
>7.82 |
| ∆pH |
<0.07 |
0.07–<0.29 |
0.29–1.02 |
>1.02–1.60 |
>1.60 |
| pHH2O |
<7.75 |
7.75–<7.92 |
7.92–8.15 |
>8.15–8.28 |
>8.28 |
| pHKCl |
<7.02 |
7.02–<7.38 |
7.38–7.75 |
>7.75–7.83 |
>7.83 |
| pHOX |
<2.21 |
2.21–<3.42 |
3.42–6.76 |
>6.76–7.33 |
>7.33 |
| SKCl (%) |
<0.0200 |
0.0200–<0.1000 |
0.1000–0.4500 |
>0.4500–0.6800 |
>0.6800 |
| SP (%) |
<0.4940 |
0.4940–<0.9320 |
0.9320–16.2080 |
>16.2080–23.0220 |
>23.0220 |
| SPOS (%) |
<0.0600 |
0.0600–<0.5360 |
0.5360–14.8160 |
>14.8160–22.2760 |
>22.2760 |
| TPA (mole H+/t) |
<0.01 |
0.01–<0.02 |
0.02–178.40 |
>178.40–322.80 |
>322.80 |
| TAA (mole H+/t) |
<0.00 |
0.00–0.00 |
0.00–0.00 |
0.00–0.00 |
0.00 |
| TSA (mole H+/t) |
<0.01 |
0.01–<0.02 |
0.02–178.40 |
>178.40–322.80 |
>322.80 |
| Pyrite (%) |
<0.0001 |
0.0001–<0.0002 |
0.0002–0.7940 |
>0.7940–1.4380 |
>1.4380 |
| Fe (ppm) |
<16.76 |
16.76–<167.00 |
167.00–906.10 |
>906.10–929.30 |
>929.30 |
| Al (ppm) |
<1.92 |
1.92–<42.90 |
42.90–163.80 |
>163.80–197.52 |
>197.52 |
| Organic C (%) |
<0.7600 |
0.7600–<1.1900 |
1.1900–1.9700 |
>1.9700–2.3800 |
>2.3800 |
| Total N(%) |
<0.0600 |
0.0600–<0.0700 |
0.0700–1.2000 |
>1.2000–0.1500 |
>0.1500 |
| C:N ratio |
<9.56 |
9.56–<14.37 |
14.37–24.44 |
>24.44–29.35 |
>29.35 |
| PO4 (ppm) |
<8.68 |
8.68–<21.58 |
21.58–80.75 |
>80.75–102.13 |
>102.13 |
| P2O5 (ppm) |
<6.48 |
6.48–<16.13 |
16.13–60.35 |
<60.35–76.33 |
<76.33 |
Table 3: Categories of brackishwater pond soils quality variables at the depth of 0.2-0.5 m of Java Island, Indonesia.
Soil acidity
Soil acidity or soil pH is a crucial variable in managing pond productivity since this variable controls chemical reactions and ponds environment. Thus, as the acid sulfate soils also present in Java Island, there is a need to measure soil pH such as pHF, pHFOX, pHH2O, pHKCl, and pHOX which are commonly measured for acid sulfate soils. The results of pH measurements indicated that in general, pond soils of 0-0.2 m depth were significantly higher compared to that measured on soils at 0.2-0.5 m depths (Table 1). The higher soil pH at 0-0.2 m depths is as a result of pond soils remediation removing acid compounds on pond soils surface. Liming to increase soils pH during pond preparation and shrimp farming is another cause of higher pond soil pH. However, the lime does not penetrate soil depth until 0.2-0.5; therefore the liming does not elevate soils pH at the depth greater than 0.2 m. in fact, lime particles only penetrate until the depth of 0.04 m (Queiroz et al., 2004) and 0.05 m (Conyers et al., 2003).
The values of soils pH (pHF, pHFOX, ΔpH, pHH2O, pHKCl, and pHOX) at the depth of 0-0.2 (7.22 ± 0.37; 6.58 ± 1.05; 0.77 ± 0.74; 8.00 ± 0.28; 7.46 ± 0.39 and 4.55 ± 1.56, respectively) and 0.2 to 0.5 m (7.15 ± 0.40; 6.64 ± 1.19; 0.58 ± 0.91; 7.94 ± 0.28; 7.33 ± 0.59 and 4.42 ± 2.08, respectively) of Java Island are higher compared to soils pH of ponds in South Sulawesi Province. Mustafa et al. (2015b) reported that pHF, pHFOX, pHKCl, and pHOX of pond soils in South Sulawesi at the depth of 0-0.2 m are 6.90 ± 0.51; 3.28 ± 2.06; 6.41 ± 1.25; and 3.47 ± 2.10, respectively; whereas at the depth of 0.2-0.5 m are 6.79 ± 0.47; 2.92 ± 2.08; 5.77 ± 1.59; and 3.13 ± 2.20, respectively. These findings indicated that based on soils pH, the soils of Java Island is preferred for shrimp ponds compared to South Sulawesi. At neutral pH (6.6-7.5), the availability of macro nutrients in soils is relative high, and in contrary, the available of toxic compounds are low; in which provides preferable environment for both natural feed and aquaculture commodities. Mustafa et al. (2015b) reported that pond soils in South Sulawesi are mostly built on swamp land dominated by acid sulfate soils and peat soils indicated by low soils pH and high potential acidity. In contrast, volcanic soils dominating soils of Java Island have higher pH (Qafoku et al., 2004; Van Ranst et al., 2008).
pHF is pH measured during the field work where the soils are still wet or commonly called as fresh soils. The pHF is applied as a rapid assessment on the present of and acid sulfate soils severity. However, the pH measurement using a pH-meter should be conducted in-situ on wet soils to prevent pyrite oxidation (common compounds in acid sulfate soils) to acid sulfate that eventually reduces the actual soil pH (English et al., 1997). pHFOX, in contrast to pHF, is the measurement of soils pH after the addition of hydrogen peroxides (30% H2O2) during field works. The additional 30% of H2O2 during pHFOX measurement is aimed to oxydizes all acidicy potential compounds in the brackishwater ponds soils. Thus, the measured pHFOX becomes lower compared to pHF at these two soil depths. The ΔpH might be applied as an indicator of the value of acidity potential on acid sulfate soils; then based on Table 2, the acid soils potential on brackishwater pond soils at 0-0.2 m depths of Java Island are significantly (P<0.05) higher compared to the soils at 0.2-0.5 m of depths. However, this observed ΔpH is relatively lower compared to soils dominated with acid sulfate soils and peat soils at the same depths (0-0.2 m) in brackishwater pond soils established in South Sulawesi, which are 3.62 ± 2.08 (Mustafa et al., 2015b). Thus, the acidity potentials of pond soils in Java Island are lower.
The results of pHKCl showed the pH of soils after H+ in an adsorption complex was pressured to enter and leave soil solution by another cation, therefore, pHKCl also known as soil pH potential. The pHKCl commonly measured to compare the value of soils pH measured extracted by H2O (pHH2O). Based on Table 1, the values of pHH2O at 0-0.2 and 0.2-0.5 m are higher compared to the value of pHKCl. The value of pHH2O is greater than 0.5 unit compared to the value of pHKCl indicates that a sum of exchangeable aluminium (Al) are found in the soil. The aluminium hydrolisis which then replaced by K results in pH decreasing of soils extracted by KCl (Hardjowigeno, 2003), in which, this process is supported by the present of Al in brackish water ponds soils of Java Island (Table 1).
The values of pHF, pHFOX, pHH2O, pHKCl, and pHOX at the depths of 0-0.2 m (7.20–7.52; 6.61–7.34; 7.96–8.21; 7.47–7.75; and 3.47– 6.54, respectively) and 0.2-0.5 m (7.14–7.48; 6.70–7.54; 7.92–8.15; 7.38–7.75; and 3.42–6.76, respectively) (Table 2) are categorized as moderate. In general, the values of these soils pH are higher at the depth of 0-0.2 m compared to that measured at the depth of 0.2-0.5 m, which is as the results of more intensive natural remediation processes at the surface pond soils and the liming which are effectively just at the upper pond soils as previously discussed. The values of soils pH measured in this study, are higher compared to that found in pond soils of South Sulawesi as reported by Mustafa et al. (2015b) where the values of pHF, pHFOX, pHKCl, and pHOX at soil depths of 0-0.2 m (6.70–7.20; 1.65–4.80; 6.10–7.20; and 1.90–4.35, respectively) which are also categorized as moderate. The moderate values of pHH2O in this study also relatively higher compared to that reported by Boyd et al. (1994) measured in pond soils of Thailand, Philippines, Ecuador, and Venezuela which are 6.0-7.0 at the soil depths of 0-0.5 m. A different categorizations of soils based on pHH2O have been established by Pusat Penelitian Tanah (1993 in Hardjowigeno and Widiatmaka, 2011) which are very acid, acid, moderately acid, neutral, moderately alkaline and alkaline at the values of <4.5; 4.5–5.5; 5.6–6.5; 6.6–7.5; 7.6–8.5; and >8.5.
Sources of acidicy
As stated earlier, that the volcanic soils are dominating soil type in Java Island; however acid sulfate soils also found in this island. Pyrite is a specific characteristic of acid sulfate soils which one of its main sources is sulphur. Oxidized pyrite results acid sulfate and ferrosulfate which release ferry sulfate when react with water and then results sulfate acid when it re-oxidized. Concentration among sulphur extracted by some extractors (SKCl, SP, and SPOS) were no significantly (P>0.05) different between these two soil depths (Table 1), however, concentration of SP and SPOS at 0.2-0.5 m of depths relatively higher compared to that observed at depth of 0-0.2 m. The similar findings are also reported by Tanikawa et al. (2013) that higher concentration of sulphur are higher at depth 0.2-0.5 compared to depth of 0-0.2 m in volcanic soils of Japan which is resulted by abundance of pedogenic minerals at the depths of 0.2-0.5 m. As the main source of acidity in acid sulfate soils, data of SPOS were considered by Ahern et al. (1998b) in determining concentration of sulphur in which to calculate lime requirement for acid sulfate soils. The concentration of sulphur in the mountain regions adjacent to coastal areas where the elevation is low and have high rainfall tend to increase (Bern et al., 2015).
TPA, TAA, and TSA, variables of soil quality indicating soil acidity have similar pattern to sulphur (SKCl, SP, and SPOS). The concentration of TPA, TAA, and TSA at the depths of 0-0.2 m and 0.2-0.5 m are no significantly different (P>0.05). McElnea et al. (2004a, b) stated that there is a correlation between TSA and SPOS in acid sulfate soils containing low concentration of organic matters. In addition, Noor (2004) reported that in acid sulfate soils, TSA and pyrite are linearly correlated. Thus, based on Table 1, concentration of pyrite between those two depths are no significantly different (P>0.05). The higher concentration of pyrite have been reported by Subagyo (2006) in actual acid sulfate soils of Kalimantan Island where concentration of pyrite ranged from 0.85 to 1.07% which were found at the surface and deeper soils. High concentration of pyrite in pond soils also reported by Mustafa et al. (2015b) in ponds of South Sulawesi where concentration of pyrite were 1.3713% at 0-0.2 m of depth and 1.7846% at depth of 0.2-0.5 m.
The concentration of pyrite categorized as very low, low, moderate, high, and very high at depths of 0-0.2 m in pond soils of Java Island are <0.0001; 0.0001–<0.0100; 0.0100– 0.6900; >0.6900–1.3800 and >1.3800%, respectively. Whereas concentration of pyrite in the same categories at the same depths in pond soils of South Sulawesi are <0.0005; 0.0005–<0.0670; 0.0670–1.7590; >1.7590–3.7945 and >3.7945%, respectively (Mustafa et al., 2015b). Higher concentration of pyrite found in ponds of South Sulawesi is resulted from domination of acid sulfate soils where the soils or sediments rich of pyrite or ferric sulphide.
Nutrients
Fe has important role in basic biological processes such as photosynthesis, respiration, fixation, and assimilation of nitrogen (Boyd, 1995). However, Fe in high concentration might be toxic to aquatic organism. Concentration of Fe in pond soils at depths of 0-0.2 and 0.2-0.5 m in this study are no significantly different (P>0.05). In this study, concentration of Fe categorized as moderate are 225.56-910.00 ppm are relatively higher compared to that reported by Boyd et al. (1994) measured in pond soils of Thailand, Philippines, Ecuador, and Venezuela which were 200- 750 ppm. As discussed earlier that the volcanic soils have high capacity in retaining phosphate because this type of soil contains more Al and Fe which resulted in low P availability for plants and eventually results severity in plants productions (Qafoku et al., 2004; Van Ranst et al., 2008; Mejías et al., 2013; Galván-Tejada et al., 2014). The concentration of Fe that categorized as moderate are 83.50-4,580.60 ppm in pond soils of South Sulawesi had been reported by Mustafa et al. (2015b).
Concentration of Al in ponds soils at the depths of 0-0.2 m are significantly (P<0.05) higher compared to that measured at the depths of 0.2-0.5 m (Table 1). Similar to Fe, high concentration of Al is toxic for gills respiratory aquatic organisms. The solubility of Al is influenced by soils pH; however, the harmful of Al in the form of Al3+ in pond soils of Java Island can be neglected as the soils pH mostly >5.5. Concentration of Al in pond soils of Java Island which is categorized as moderate ranged between 76.08 to 175.80 ppm at soil depths of 0-0.2 m (Table 2) whereas concentration of Al in this category at soil depths 0.2-0.5 m are 42.90-163.80 ppm (Table 3). Concentration of Al in category of moderate found in ponds soils of Thailand, Philippines, Ecuador and Venezuela are 200.00-500.00 ppm (Boyd et al., 1994); whereas the same concentration for pond soils of South Sulawesi are 81.00-317.60 ppm (Mustafa et al., 2015b).
Concentration of organic matters or organic C in brackishwater pond soils are always considered in brackishwater ponds management because they can affect phisical, biological and chemical characteristics of soils. Concentration of organic C at the depths of 0-0.2 and 0.2-0.5 m in this study are no significantly different (P>0.005) (Table 1). Yuan et al. (2000) reported that volcanic soils contain high organic matters; in contrast, organic matters in brackishwater pond soils of Java island are scarce. The concentration of organic matters at soil depths of 0-0.2 and 0.2-0.5 m which categorized as moderate are 1.2600–2.0200 and 1.1900– 1.9700%, respectively (Tables 2 and 3). The concentration of organic C in this category is similar to that reported in ponds soils of Thailand, Philippines, Ecuador and Venezuela which are 1.0-2.5% Boyd et al. (1994). However, concentration of organic C in this category measured in this study are relatively lower compared to that reported by (Mustafa et al., 2015b) in pond soils of South Sulawesi, which are 1.6855–5.6050%. The concentration of organic C measured in this study also relatively low compared to concentration of organic C categorized as moderate, which are 2.0-3.0%, for agricultural plants in Indonesia (Pusat Penelitian Tanah, 1993 in Hardjowigeno and Widiatmaka, 2011). Concentration of organic C ranged between 1.00 to 1.80% are categorized as moderate in relating to soil physical fertility by Charman and Roper (2007) and 1.00-1.59% based on assessment of soils condition Hazelton and Murphy (2009). Low concentration of organic C in brackishwater pond soils of Java Island is caused by the absent of peat soils; whereas Boyd et al. (2002) reported that concentration of organic C in peat soils commonly greater than 15%.
Organic matters produce C and nutrients such as nitrogen. Concentration of total N in soils describes the amount of N in soils which mostly in an-organic forms that is no instantly available for plants and algae. N is macro nutrient in ponds aquaculture and has important role in measuring pond soils fertility. Concentration of total N in pond soils at 0-0.2 m depth in this study are significantly (P<0.05) higher compared to that measured at soil depth of 0.2-0.5 m. Higher concentration of total N at the depth of 0-0.2 m is a result of application of N fertilizers such as Urea and ZA (Zwavelzuure Ammonium or Ammonium Sulfate) through pond soils initial fertilization and or continuant fertilizations. Concentration of total N in pond soils of Java Island in various categories at soil depths of 0-0.2 and 0.2-0.5 m are presented on Tables 2 and 3, respectively. Concentration of total N measured in this study is similar to concentration of total N within each category as reported by previous studies in Thailand, Philippines, Ecuador, and Venezuela where the concentration of total N in categories of very low, low, moderate, high, and very high are <0.15; 0.15–0.25; 0.25–0.40; 0.40–0.50; and >0.50%, respectively (Boyd et al., 1994). Whereas, concentration of total N in those categories are <0.0600; 0.0600–<0.0700; 0.0700–0.1300; >0.1300–0.1700; and >0.1700%, respectively in South Sulawesi (Mustafa et al., 2015b). In addition, Pusat Penelitian Tanah (1993 in Hardjowigeno and Widiatmaka 2011) reported a series of concentration of total N in these consecutive categories are <0.10; 0.10–0.20; 0.20–0.50; 0.50–0.75; and >0.75%, respectively; whereas Bruce and Rayment (1982) distributed concentration of total N <0.05; 0.05–0.15; 0.15– 0.25; 0.25–0.50; and >0.50%, respectively on those series categories.
The soil C:N ratios affect soil microbial activities in mineralizing organic matters to release an-organic nutrients (Boyd, 1995). Relatively similar concentration of organic C at both pond soil depths, yet lower concentration of total N at soil depth of 0.2-0.5 m result in significantly (P<0.05) higher C:N ratios at pond soils depth at 0.2-0.5 m compared to that measured at pond soils depth of 0-0.2 m. Lower C:N ratio at surface soils compared to deeper soils (25 vs. 39) also reported by Subagyo (2006) in actual acid sulfate soils in Kalimantan Island. C:N ratio of 8.35-16.70 is categorized as moderate in pond soils of South Sulawesi (Mustafa et al., 2015b), whereas C:N ratios of 11-15 is categorized as moderate for agricultural soils in Indonesia (Pusat Penelitian Tanah, 1993 in Hardjowigeno and Widiatmaka, 2011). According to Hazelton and Murphy (2009), C:N ratio of 15-25 are categorized as moderate and in these ratio, the rate of soil organic matters decomposition is low.
Phosphorus (P) is highly required by natural feed in pondsmain food sources of brackish water commodities cultured under traditional technology. P is limited factor for primary productivity in ponds where the roles of P are crucial in photosynthesis, respiration, storage and transfer of energy, cell division, cell growth, and some other processes (Price, 2006). Concentration of PO4 and P2O5 in soils at depth of 0-0.2 m measured in this study are significantly (P<0.05) higher compared to that measured at pond soils depth of 0.2-0.5 m. The application of fertilizers such as SP-36 containing PO4 and P2O5 at the soil surfaces as pond soils initial fertilizations and at ponds water column as continuant fertilization during farming, and eventually settle on pond bottoms. The relatively similar results have been reported by Subagyo (2006) that concentration of available P (P2O5–Bray) is higher at surface soils (19.3 ppm) compared to that measured at deeper soils (12.6 ppm) at actual acid sulfate soils in Kalimantan Island. Concentration of PO4 as much as 13.2845–67.3450 ppm are categorized as moderate in pond soils of South Sulawesi at depth of 0-0.2 m (Mustafa et al., 2015b). Concentration of P2O5–Bray as much as 16.0–25.00 ppm and P2O5 –Olsen between 11.60 and 22.80 ppm are categorized as moderate by Pusat Penelitian Tanah (1993 in Hardjowigeno and Widiatmaka 2011) for agricultural soils in Indonesia.
Implications
Tiger shrimp, whiteleg shrimp, milkfish, nile fish, mud crab, and seaweed are common commodities cultured in this studied ponds. However, data of pond productions from each studied ponds are scarce; therefore, the assessment to measure optimum concentration of each soil variable based on this study is not possible. Wide range of data measured from this study indicate wide distribution of each soil quality variable, however ponds with these wide ranged value of soil quality variables are still acceptable for culturing shrimp, fish and seaweed which their productions are also varies. Therefore, the result of this study is not recommended in measuring association between pond soils quality and ponds productivity. The data measured in this study, however, have a role as initial information in interpreting variables of pond soils quality of Java Island, Indonesia particularly in categorizing soil quality variable concentrations whether very low, low, moderate, high or very high and also in making decisions on pond soils management.
Conclusion and recommendation
The results of study indicate that volcanic soils are dominant soil type in brackish water ponds of Java Island, Indonesia. In general, the soil pH and nutrients at soil depths of 0-0.2 m are higher compared to that measured at soil depths of 0.2-0.5 m. The soil quality variables such as SKCl, SP, SPOS, TPA, TAA, TSA, and pyrite were relatively similar between soil depths of 0-0.2 and 0.2-0.5 m. Data of soil quality variables have been arranged in tp concentration categories (very low, low, moderate, high and very high) to facilitate a comparison to other data on soil quality of brackish water ponds. The results of this study is not recommended for assessing the association between soil quality and brackish water ponds productivity, yet can be applied as a basic measurement in determinating whether the soil quality variables are in the category of very low, low, moderate, high or very high and to facilitate decission in improving pond soils quality of Java Island.
Ackonwledgement
High grateful is addressed to Muhammad Arnol, Ilham, and Haking made for their assistance during field works and sample preparations for laboratory analysis. Thanks to Rosiana Sabang and Rahmiyah for their effort on analyzing soil samples in the laboratory. Thanks to the Ministry of Marine Affairs and Fisheries for funding this study through Issuance of Spending Authority (Daftar Isian Pelaksanaan Anggaran or DIPA) 2010- 2015 allocated for Research Institute for Coastal Aquaculture and Fisheries Extension, Maros.
20093
References
- Ahern, C.R., Blunden, B. (1998) Designing a soil sampling and analysis program.In: Ahern, C.R., Blunden, B., and Stone, Y. (editors), Acid Sulfate Soils Laboratory Methods Guidelines. Acid Sulfate Soil Management Advisory Committee, Wollongbarpp: 2.1-2.6.
- Ahern, C.R., Blunden, B., Sullivan, L.A., McElnea, A.E. (2004)Soil sampling, handling, preparation and storage for analysis of dried samples. In: Acid Sulfate Soils Laboratory Methods Guidelines. Queensland Department of Natural Resources, Mines and Energy, Indooroopillypp: B1-1-B1-5.
- Ahern, C.R., McElnea, A. (2004) Calculated sulfur parameters. In: Acid Sulfate Soils Laboratory Methods Guidelines. Queensland department of Natural Resources, Mines and Energy, Indooroopillypp: B11-1–B11-2.
- Ahern, C.R., McElnea, A.,Baker, D.E. (1998a) Acid neutralizing capacity methods. In: Ahern, C.R., Blunden, B.,and Stone, Y. (editors), Acid Sulfate Soils Laboratory Methods Guidelines. Acid Sulfate Soil Management Advisory Committee, Wollongbarpp: 6.1-6.4.
- Ahern, C.R., McElnea, A., and Baker, D.E. (1998b). Peroxide oxidation combined acidity and sulfate. In: Ahern, C.R., Blunden, B., and Stone, Y. (eds.), Acid Sulfate Soils Laboratory Methods Guidelines. Acid Sulfate Soil Management Advisory Committee, Wollongbarpp: 4.1-4.17.
- Ahern, C.R., Rayment, G.E. (1998) Codes for acid sulfate soils analytical methods. In: Ahern, C.R., Blunden, B., and Stone, Y.(eds.), Acid Sulfate Soils Laboratory Methods Guidelines.Acid Sulfate Soil Management Advisory Committee, Wollongbarpp: 3.1-3.5.
- Asaad, A.I.J., Mustafa, A. (2011)Spatial distribution of brackishwater pond soil characteristics in Pekalongan City Central Java Province. Indonesian Aquaculture Journal6,91-105.
- Avnimelech, Y., Ritvo, G. (2003)Shrimp and fish pond soils: processes and management. Aquaculture 220, 549-567.
- Banerjee, A., Chattopadhyay, G.N., Boyd C.E. (2010) Soil system-based approach: A tool for fish pond fertilization. Better Crops 94,22–24.
- Bern, C.R., Chadwick, O.A., Kendall, C., Pribil, M.J. (2015) Steep spatial gradients of volcanic and marine sulfur in Hawaiian rainfall and ecosystems. Science of theTotal Environment514, 250-260.
- Boyd, C.E. (1976)Chemical and textural properties of muds from different depths in ponds.Hydrobiologia48, 141-144.
- Boyd, C.E. (1992) Shrimp pond bottom soil and sediment management.In:Wyban, J. (editor), Proceedings of the Special Session on Shrimp Farming. World Aquaculture Society, Baton Rougepp: 166-181.
- Boyd, C.E. (1995) Bottom Soils, Sediment, and Pond Aquaculture. Chapman and Hall, New Yorkp: 348.
- Boyd, C.E., Queiroz, J.F. (2014)The role and management of bottom soils in aquaculture ponds. Infofish International 2, 22-28.
- Boyd, C.E., Tanner, M.E., Madkour, M., Masuda, K.(1994) Chemical characteristics of bottom soils from freshwater and brackishwater aquaculture ponds. Journal of the World Aquaculture Society 25, 517-534.
- Boyd, C.E., Wood, C.W., Thunjai, T. (2002)Aquaculture Pond Bottom Soil Quality Management. Pond Dynamics/Aquaculture Collaborative Research Support Program Oregon State University, Corvallis, Oregon p: 41.
- Bruce, R.C., Rayment, G.E. (1982) Analytical Methods and Interpretations Used by the Agricultural Chemistry Branch for Soil and Land Use Surveys. Queensland Department of Primary Industries, Brisbane p: 10.
- Caipang, C.M.A., Fos, M.A., Golez, M.S.M. (2012) Bottom soil characteristics of brackishwater pond after a culture period. International Journal of the Bioflux Society 5, 415-420.
- Charman, P.E.V., Roper, M.M. (2007) Soil organic matter. In:Charman, P.E.V. and Murphy, B.W. (editors), Soils – Their Properties and Management. Third edition. Oxford University Press, Melbourne. pp: 276-285.
- Conyers, M.K., Heenan, D.P., McGhie, W.J., Poile, G.P. (2003) Amelioration of acidity with time by limestone under contrasting tillage. Soil & Tillage Res 72, 85-94.
- Devnita, R., Arifin, M., Salim, E.H., Sudradjat, A., Hudaya, R., et al. (2010) Soils developed on volcanic materials in West Java, Indonesia. International J Arts Sci3, 180-192.
- Ekubo, A.T., Abowei, J.F.N. (2011) A review fishpond soil management principles in Nigeria.Res J Environment EarthSci3,694-703.
- English, S., Wilkinson, C., Basker, V. (1997)Survey Manual for Tropical Marine Resources.Second edition.Australian Institute of Marine Science, Townsvillepp: 119-195.
- Erfandi, D., Rachman, A.(2011) Identification of soil salinity due to seawater intrusion on rice field in the northern coast of Indramayu, West Java.J Tropical Soils16,115-121.
- Sulaeman., E. (2009) Analysis of Chemical Soil, Plant, Water, and Fertilizer. Research Institute for Soil, Bogor p: 234.
- Galván-Tejada, N.C., Peňa-Ramirez, V., Mora-Palomino, L., Siebe, C.(2014)Soil P fractions in a volcanic soil chronosequence of Central Mexico and their relationship to foliar P in pine trees.JPlant Nutrition Soil Sci177, 792-802.
- Giap, D.H., Yi, Y., Yakupitiyage, A.(2005) GIS for land evaluation for shrimp farming in Haiphong of Vietnam.Ocean & Coastal Management48, 51-63.
- Hardjowigeno, H.S. (2003) Soil Classification and Pedogenesis.AkademikaPressindo, Jakarta p: 354.
- Hardjowigeno, S.W. (2011) Land Suitability Assessment and Land Use Planning.GadjahMada University Press, Yogyakarta p: 352.
- Hazelton, P., Murphy, B. (2009)Interpreting Soil Test Results: What do All the Numbers Mean? CSIRO Publishing, Collingwoodp: 152.
- Jensen, M. (1993) Soil conditions, vegetation structure and biomass of a Javanese homegarden. Agroforestly Systems24, 171-186.
- Kamariah, Asaf, R., Athirah, A. (2014)Distribution of brackishwater pond soil quality in Probolinggo Regency, East Java Province. In:Sugama, K., Kusnendar, E., Rachmansyah, Giri, IN.A.,Yuhana, M., Kristanto, A.H., Imron, Radiarta, IN., and Dewi, R.R.S.P.S. (editors), Proceedings of the 2014 Aquaculture Technology Innovation Forum.Center for Aquaculture Research and Development, Jakarta p: 273-286.
- Kantasubrata, J. (2012) Control Sample, Control Chart, Evaluation and Follow Up. Presented at the Quality Assurance Training Data Testing in Bandung. RCChem Learning Centre, Bandung p: 23.
- Karthik, M., Suri, J., Saharan, N.,Biradar, R.S. (2005) Brackish water aquaculture site selection in PalgharTaluk, Thane district of Maharashtra, India, using the techniques of remote sensing and geographical information system. Aquacultural Engineering32, 285-302.
- Kumar, P., Jetani, K.L., Yusuzai, S.I., Sayani, A.N., Dar, S.A., et al. (2012) Effect of sediment and water quality parameters on the productivity of coastal shrimp farm. Advances in Applied Science Research3,2033-2041.
- McElnea, A.E., Ahern, C.R. (2004a) KCl extractable pH (pHKCl) and titratable actual acidity (TAA).In: Acid Sulfate Soils Laboratory Methods Guidelines. Queensland department of natural resources, Mines and Energy, Indooroopillypp: B2-1-B2-3.
- McElnea, A.E., Ahern, C.R. (2004b)Peroxide pH (pHOX), titratable peroxide acidity (TPA) and excess acid neutralising capacity (ANCE). In: Acid Sulfate Soils Laboratory Methods Guidelines. Queensland Department of Natural Resources, Mines and Energy,Indooroopillypp: B3-1-B3-7.
- McElnea, A.E., Ahern, C.R. (2004c)Sulfur-peroxide oxidation method. In: Acid Sulfate Soils Laboratory Methods Guidelines.Queensland department of Natural Resources, Mines and Energy, Indooroopilly. pp: B7-1-B7-2.
- McElnea, A.E., Ahern, C.R. (2004d) Sulfur 1M KCl extraction (SKCl). In: Acid Sulfate SoilsLaboratory Methods Guidelines. Queensland department of natural resources, Minesand Energy, Indooroopilly. pp: B8-1-B8-2.
- Mejías, J.H., Alfaro, M., Harsh, J. (2013) Approaching environmental phosphorus limits on a volcanic soil of Southern Chile. Geoderma207-208, 49-57.
- Menon, R.G. (1973) Soil and Water Analysis: A Laboratory Manual for the Analysis of Soil and Water.Proyek Survey O.K.T. Sumatera Selatan, Palembangp: 190.
- MMAF (Ministry of Marine Affairs and Fisheries). (2015) Marine and Fisheries in Figures 2015. Ministry of Marine Affairs and Fisheries, Jakartap: 308.
- Mustafa, A. (2007)Improving Acid Sulfate Soils for Brackish Water Ponds in South Sulawesi, Indonesia.Doctorof PhilosophyThesis. The University of New South Wales, Sydney p: 418.
- Mustafa, A. (2012) Land suitability criteria for various commodities in brackishwater ponds. Media Akuakultur 7,108-118.
- Mustafa, A., Athirah, A. (2014) Application of path analysis in determination of effect of soil and water quality on total production of brackishwaterpond inDemak Regency, Central Java Province. J KelautanNasional9,65-79.
- Mustafa, A., Mangampa, M., danRatnawati, E. (2015a) Harvest Profits from Shrimp Fingerling Production in a Short Time. Andi Offset, Yogyakartap: 178.
- Mustafa, A., Sammut, J., Rimmer, M.A. (2015b)Determination of concentration categories of various soil quality chemical variables in different depths in brackishwater ponds of South Sulawesi Province, Indonesia. J RisetAkuakultur10,619-631.
- Mustafa, A., Suhaemi, R.A., Hasnawi. (2015c) Land management options for traditional technology based on the characteristics of brackishwater pond soil in TayuSubdistrict, Pati Regency, Central Java Province. JurnalRisetAkuakultur10, 127-140.
- Ndome, C.B., Udo, I.U., Akpan, I.I., Udom, C. (2012) Effect of water quality and bottom soil properties on the diversity and abundance of macrobenthic fauna in some tropical grow-out earthen fish ponds. Ecologia2, 12-22.
- Noor, M. (2004) Swamp Land: Characteristic and Management of Problematic Acid Sulfate Soils.PT RajaGrafindoPersada, Jakarta p: 238.
- Perryman, S.E., Lapong, I., Mustafa, A., Sabang, R., Rimmer, M.A. (2017) Potential of metal contamination to affect the food safety of seaweed (Caulerpa spp.) cultured in coastal ponds in Sulawesi, Indonesia. Aquaculture Reports 5, 27-33.
- Price, G. (2006) Australian Soil Fertility Manual.Third edition. CSIRO Publishing, Collingwoodp: 168.
- Qafoku, N.P., Van Ranst, E., Noble, A., Baert, G. (2004) Variable charge soils, their mineralogy, chemistry and management.Advances in Agronomy84,157-213.
- Queiroz, de J.F., Nicolella, G., Wood, C.W., Boyd, C.E. (2004) Lime application methods, water and bottom soil acidity in fresh water fish ponds. Scientia Agricola61,469-475.
- Rayes, M.L. (2007). Method of Inventory of Land Resources.Penerbit Andi, Yogyakarta p: 298.
- Salam, M.A., Ross, L.G., Beveridge, C.M.M. (2003) A comparison of development opportunities for crab and shrimp aquaculture in southwestern Bangladesh, using GIS modeling.Aquaculture220, 477-494.
- Sammut, J. (1999) Amelioration and management of shrimp ponds in acid sulfate soils: key researchable issues. In: Smith, P.T. (editor),Towards Sustainable Shrimp Culture in Thailand and the Region. ACIAR Proceedings No. 90. Australian Centre for International Agricultural Research, Canberra. pp: 102-106.
- Sartohadi, J., Jayamulya, Dewi, N.I.S. (2012)Introduction to Soil Geography.PustakaPelajar, Yogyakarta p: 196.
- Siddique, M.A.M., Barua, P., Ghani, M.H. (2012) Comparative study of physic-chemical properties of soil according to the age of aquaculture pond of Bangladesh.Mesopotamian Journal of Marine Science27,29-38.
- Subagyo, H. (2006)Tidal swamp land. In: Ardi, S.D., Kurnia, U., Mamat, H.S., Hartatik, W., and Setyorini, D. (eds.), Characteristic and Management of Swamp Land. Agricultural Land Resources Research and Development Institute, Bogorp: 23-98.
- Suhaimi, R.A., Hasnawi, and Ratnawati, E. (2013)Land suitability for tiger prawn (Penaeus monodon) in brackishwater ponds of Brebes Regency, Central Java. J Riset Akuakultur8, 465-477.
- Sulaeman, S., Eviati. (2005) Technical Guidelines for Soil, Plant, Water and Fertilizer Analysis. Research Institute for Soil, Bogor p: 136.
- Supriyo, H., Matsue, N., Yoshinaga, N. (1992) Chemical and mineralogical properties of volcanic ash soils from Java.Soil Science and Plant Nutrition38,443-457.
- Tanikawa, T., Yamashita, N., Aizawa, S., Ohnuki, Y, Yoshinaga, S., et al. (2013) Soil sulfur content and its spatial distribution in a small catchment covered by volcanic soil in the montane zone of central Japan. Geoderma197–198, 1-8.
- Tarunamulia, Mustafa, A., Hasnawi, and Kamariah. (2015)The feasibility of silvofishery pond engineering in BlanakanSubdistrict, Subang Regency, West Java Province. Jurnal Riset Akuakultur10,579-592.
- Utojo, Hasnawi, and Paena, M. (2013a) Characteristic, suitability, and management of land in brackishwater ponds of Gresik Regency, East Java Province.J RisetAkuakultur8,311-324.
- Utojo, Mustafa, A., Kamariah. (2013b) Evaluation of land biophysical suitability for tiger shrimp (Penaeusmonodon) culture sustainable in Indramayu Regency, West Java. In:Haryanti, Rachmansyah, Radiarta, IN., Kristanto, A.H., Imron, Sugama, K., Pantjara, B., and Azwar, Z.I. (editors), Proceedings of the 2013 Aquaculture Technology Innovation Forum. Center for Aquaculture Research and Development,Jakarta.pp: 1013-1024.
- Utojo, Mustafa, A., Suhaimi, R.A. (2013c) Determination of land suitability for sustainable brackishwater pond in Pasuruan Regency, East Java. In: Isnansetyo, A., Husni, A., Djumanto, Rachmawati, N.,Rustadi, Suadi, and Utadi (editors), Proceedings of the Annual National Seminar X Marine and Fisheries Research Results 2013. Department of Fisheries, Faculty of Agriculture, GadjahMada University, Yogyakarta p: 12.
- Utojo, Pirzan, A.M., Mustafa, A. (2012) Land suitability evaluation in coastal area of Lamongan, East Java for developing brackishwater pond trough analysis of characteristic, problem, and management of land. In:Haryanti, Rachmansyah, Imron, Sunarto, A., Sugama, K., Sumiarsa, G.S., Parenrengi, A., Azwar, Z.I., Sudradjat, A., and Kristanto, A.H. (editors), Proceedings ofIndoaqua–Aquaculture Technology Innovation Forum 2012. Center for Aquaculture Research and Development, Jakartapp: 939-952.
- Utojo, Suhaimi, R.A.,Asaad, A.I.J. (2014)Determination of land suitability spatially in Tuban Regency, East Java Province using Geographical Information System (GIS). In: Sugama, K., Kusnendar, E., Rachmansyah, Giri, IN.A.,Yuhana, M., Kristanto, A.H., Imron, Radiarta, IN., and Dewi, R.R.S.P.S. (editors), Proceedings of the 2014 Aquaculture Technology Innovation Forum. Center for Aquaculture Research and Development, Jakarta pp: 509-519.
- Van Ranst, E., Utami, S.R., Shamshuddin, J. (2002) Andisols on volcanic ash from Java Island, Indonesia: Chemical properties and classification. Soil Science167,68-79.
- Van Ranst, E., Utami, S.R., Verdoodt, A., Qafoku, N.P. (2008) Mineralogy of perudicAndosol in Central Java, Indonesia.Geoderma144, 379-386.
- Watling, K.M., Ahern, C.R., Hey, K.M. (2004) Acid sulfate soil field pH test. In: Acid Sulfate Soils Laboratory Methods Guideliners. Queensland Department of Natural Resources, Mines and Energy, Indooroopilly, Queensland.pp: HI-1-HI-4.
- Widiatmaka, Ambarwulan, W., Setiawan, Y., Walter, C. (2016) Assessing the suitability and availability of land for agriculture in Tuban Regency, East Java, Indonesia.Applied and Environmental Soil Sci pp:1-13.
- Yuan, G., Theng, B.K.G., Parfit, R.L., Percival, H. (2000) Interaction of allophane with humic acid and cations. European JSoil Sci51, 35-41.


