Keywords
Fish products; Soybean flour; Frozen storage; Bissaria; Cooking loss
Introduction
Fish is one of the most important sources of animal protein available in the tropics and has been widely accepted as a source of high quality protein and other elements for the maintenance of healthy body (Gomma, 2005). Fish contain high quality protein, low in saturated fatty acids and contain high content of unsaturated fatty acids (Venugopal & Shahidi, 1995). There is a large quantity of very small fish landed as by-catch which do not find a ready market as fresh fish. Sand smelt (Atherina boyeri) lives in the Marmara Sea, Aral and Caspian Sea Black Sea and Aegean Sea (Altun, 1999). The numbers of sand smelt fish (Bissaria) has increased in the Lake of Qarun In the recent years. Sand smelt fish is characterized by the high edible portion and small size but is unacceptable for consumer. Bissaria is an uneconomical fish in Egypt. In recent years, the increases civilizations have led to consumer's preference to ready-to-eat foods (Cakli et al., 2005). Fish burgers and fingers are one of the secondary minced fish based products and are popularly distributed frozen for longer shelf life (Jamilah, 2004). There are few published studies on the effect of frozen storage on the chemical composition sand smelt fish burger and finger. Freezing is the process that lowers the temperature to below the freezing point. These temperatures allow most of the water to turn into ice. The freezing point depends on the substances dissolved in the fluid of the tissue. Fish contain 75–80% water. The freezing process concerns the removal of latent heat during the phase transition of water from liquid to solid and removal of sensible heat, depending on the reduction of temperature (Gokoglu and Yerlikaya, 2015). Frozen storage has been widely employed to retain fish properties before it is consumed or employed in other technological processes. Fish is usually processed in different techniques such as boiling, smoking, roasting, frying and grilling. These processing and cooking techniques improved the hygienic quality by inactivation of pathogenic microorganisms and enhanced the digestibility and bio-availability of nutrient in the digestive tract (Kocatepe et al., 2011).
Therefore, the overall aims of this study was to investigate
1- Determine the changes in proximate composition of sand smelt frozen fish products stored at -18ºC for a 3 month period.
2- Determine the changes in cooking loss of sand smelt fish burger and finger during frozen storage at -18 ? C, for 90 days.
Materials and Methods
Fish
About 25 kg of fresh sand smelt fish (Atherina hepsstia) was obtained from Qarun Lake, Fayoum Governorate, Egypt during April, 2017. Fresh fish were transported in ice-box to the laboratory of Fish processing and technology Research Station (at Fayoum), National Institute of Oceanography and Fisheries (NIOF).
Filling materials
Filling materials used in the processing of fish products were Soybean flour (SF) and Minced boiled potatoes (MBP). SF was obtained from Food Technology Research Institute, Agriculture Research Center (ARC) at Giza Governorate, Egypt. MBP was prepared by boiling potatoes for 15 min, peeled and minced.
Ingredients Sunflower oil, wheat flour, starch, sugar, salt, garlic, onion, spices, and other additives were obtained from the local market at Fayoum Governorate.
Preparation of fish
Fish was gutted, beheaded and washed gently with tap water. The edible portion of sand smelt using an electric meat mincer (Braun plus 1300). The minced fish was divided into two portions, kept to process fish products of burger and finger.
Fish burger formulation and processing
Table 1 indicates the recipe of sand smelt burger as mentioned by (Chandrasckhar and Mohite 1978) and sand smelt finger by (Çakli et al., 2005 and Tokur et al., 2006). The experimental formulated burger and finger samples were made by replacing the minced fish with the filling material at the desired level as illustrated in Table 1. All the formulations were needed by hand until homogenous dough was obtained. Portions of 50g were shaped (8.5 cm diameter and 1.0 cm thickness) by manually operated forming machine (NOAW- Affetacrane, Italy). The dough fish finger was shaped into fingers and frozen at -18C for 2 h before battering. The frozen fish fingers were rapidly coated with batter solution (3 parts of water plus 2 parts contained 94% maize flour, 2% skim milk, 2% egg yolk and 2% salt) and then they were rubbed with ground crumb. Burger and finger samples were packaged in polyethylene bags and stored at -18°C until required for analysis.
| Fish burger |
Fish fingers |
| Ingredients |
% |
Ingredients |
% |
| Fish mince |
75 |
Fish mince |
93.5 |
| Vegetable oil |
9 |
Salt |
1.5 |
| Starch |
8 |
Sugar |
1 |
| Salt |
2.3 |
Wheat flour |
3 |
| Sodium bicarbonate |
0.4 |
Cumin |
0.24 |
| Onion |
2.5 |
Onion |
0.24 |
| Garlic |
0.5 |
Garlic powder |
0.24 |
| Polyphosphate |
0.3 |
Black pepper |
0.24 |
| *Spices mixture |
2 |
Thyme |
0.04 |
*Spices mixture composed of 32% black pepper, 22.5% coriander, 15% cumin, 10% cardamom, 9% red pepper, 7.5% cubeb and 4% clove.
Table 1: Recipes of sand smelt fish burger and fingers.
Storage studies
The formulated samples along with the control samples of burgers and fingers were packed in polyethylene bags and stored in deep freezer at –18°C for 90 days. Samples of burger and finger were withdrawn periodically at intervals of 15 days for analysis.
Analytical methods
Proximate chemical composition
Moisture, crude protein, crude fat and ash contents were determined according to AOAC (2012). Total carbohydrates were calculated by difference method using the following equation: Total carbohydrates =100% - (% protein + % fat + % ash + % moisture) (Merrill and Watt, 1973).
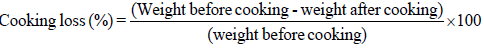
Cooking loss
Cooking loss and was determined and calculated as described by Roland et al., (1981) using the following equations:
Sand smelt fish samples cooked by frying method
Statistical analysis: Data obtained were analyzed statistically using the least significant difference test (LSD) at (p ≤ 0.05) and Standard Error (Mean ± SE) which calculated using SPSS 16.0 for windows (SPSS Inc., Chicago, USA).
Results and Discussion
Chemical analysis was carried in the uncooked burger and fingers samples to determine changes occurred in moisture, protein, fat, ash and carbohydrates contents during frozen storage period.
Moisture
Changes in moisture content of raw (uncooked) fish products made from sand smelt fish were determined during storage period at -18 ?C for 90 days and results obtained are given in Table 2. Moisture content of burger samples immediately after production were determined by 60.22, 60.63 and 62.22 % for control sample and those formulated by adding 15% SF and 15% MBP, respectively. These values of moisture content gradually decreased during storage, down to 56.31, 55.15 and 57.54% respectively at the end of 90 days storage. Moisture contents of fish fingers showed similar changes during frozen storage under the same conditions. Data presented in Table 3 indicated that moisture contents of control, 20% SF and 15% MBP finger sample gradually decreased from 64.77, 63.34 and 65.12% at day zero storage to 59.10, 58.15 and 61.82%, respectively. The total losses in moisture contents of sand smelt burger at the end of storage period were 8.42, 7.13 and 7.5% in control, 15% SF and 15% MBP samples, respectively. Similarly moisture losses of control, 20% SF and 15% MBP samples were 10.22, 6.69 5.10% respectively. This observation indicated that incorporation of filling materials in the processing of sand smelt fish products improved the water binding capacity in these products during frozen storage. The improving effect of filling materials was more pronounce in fish fingers particularly with minced boiled potatoes. Similar findings were reported by Baaiu (1974), El- Akeel (1983), Abo-zied (1995), Gomma (2005), Ibrahim and El- Sherif (2008) and Gandotra et al. (2012). Also these results agreed with studies made on fish products processed from other types of fish. Orban et al. (2002). In sea bass (Dicentrarchus labrax) fillets, moisture content decreased during frozen storage (Benjakul et al. 2005). This decrease in moisture content was attributed to the sublimation of ice in frozen storage and the loss of drip during thawing process. Meanwhile, in contrary to these findings, in a study made on crab, Zamir et al. (1998) found an increasing trend in moisture content during storage and attributed this increase to the loss of water holding capacity of tissue.
| Fish burger |
Fish fingers |
Substitution Level (%) |
| Minced fish (g) |
(SF) or (MBP)(g) |
Minced fish (g) |
(SF) or (MBP) (g) |
| 75.00 |
- |
93.50 |
- |
0 |
| 67.50 |
7.50 |
84.15 |
9.35 |
10 |
| 63.75 |
11.25 |
79.47 |
14.03 |
15 |
| 60.00 |
15.00 |
74.80 |
18.70 |
20 |
Table 2: Substitution levels of the filling materials (SF and MBP) used in the preparation of sand smelt fish burger and fingers.
| Storage period (day) |
Fish Burger |
Fish Finger |
| Control |
SF |
MBP |
Control |
SF |
MBP |
| -15% |
-15% |
-20% |
-15% |
| 0 |
60.22 ± 1.15 |
60.63 ± 0.941 |
62.22 ± 1.73 |
64.77 ± 0.444 |
63.34 ± 0.773 |
65.12 ± 1.22 |
| 15 |
59.52 ± 0.877 |
59.86 ± 1.15 |
61.88 ± 1.08 |
64.42 ± 0.814 |
62.85 ± 1.06 |
64.90 ± 0.519 |
| 30 |
59.05 ± 0.606 |
59.09 ± 1.20 |
61.05 ± 0.606 |
62.55 ± 0.317 |
62.22 ± 0.641 |
64.15 ± 0.663 |
| 45 |
58.40 ± 0.808 |
57.92 ± 0.531 |
59.22 ± 1.00 |
61.18 ± 0.681 |
61.72 ± 0.415 |
63.33 ± 0.676 |
| 60 |
57.22 ± 0.577 |
57.18 ± 0.681 |
58.77 ± 1.02 |
61.55 ± 0.894 |
60.85 ± 0.490 |
63.02 ± 0.588 |
| 75 |
56.55 ± 0.317 |
56.70 ± 0.404 |
58.30 ± 0.173 |
60.30 ± 0.750 |
59.94 ± 0.542 |
62.45 ± 0.259 |
| 90 |
56.31 ± 3.00 |
55.15 ± 0.663 |
57.54 ± 0.426 |
59.10 ± 0.635 |
58.15 ± 0.663 |
61.82 ± 0.473 |
| Sig. |
0.124 |
0.006 |
0.015 |
0 |
0.001 |
0.037 |
Data are presented as mean ± SE of 3 replicates. –SE: standard error. -Significant difference at P<0.05.SF: Soybean flour, MBP: Minced boiled potato.
Table 3: Changes in moisture content of sand smelt fish products during frozen storage at – 18 ? C.
Protein
Changes in protein contents of fish burger and finger during frozen storage are shown in Table 4. The results indicated that protein contents of control and formulated burgers samples gradually decreased during storage. As shown in Table 4 protein content of fresh burger samples were 43.16, 41.91 and 40.63% (on dry weight) for control, 15% SF and 15% MBP sample, respectively. After 90 days of frozen storage, protein contents of these samples decreased to 34.79, 31.10 and 31.68% (on dry weight), respectively. Changes in protein contents of fish fingers showed similar behavior during frozen storage under the same conditions. The results presented in Table 4 indicated that protein contents of control, 20% SF and 15% MBP decreased from 50.76, 44.46 and 43.15% (on dry weight) at zero time of storage to 38.51, 35.01 and 31.64 (on dry weight basis), respectively at the end of 3 months of storage. Determination of protein contents of sand smelt products during frozen storage revealed that protein losses increased as the storage period extended and the loss was more pronounced in fish finger samples comparing with burger samples. Data shown in Table 4 indicated that protein losses in burger samples stored for 30, 60 and 90 days ranged between 5.02 – 7.21, 12.86 – 14.62 and 19.39 – 25.79%, respectively. Similarly, fish fingers samples stored for 30, 60, 90 days under the same frozen conditions lost about 5.9 -9.52, 13.36 – 18.8 and 21.3 – 26.70% of their initial protein contents. It could be noticed that fingers samples formulated by adding the filling material SF showed the lowest value of protein loss. Protein loss during frozen storage of fish products had been studied and several mechanisms were suggested to explain this behavior. Baaiu (1974) attributed protein loss in mackerel fish during 180 days of frozen storage to the leakage of some soluble protein components in drip during thawing process. Abo-Taleb (1997) reported that the changes in protein content during frozen storage may be due to the loss of some volatile nitrogenous compounds during frozen storage and protein hydrolysis by enzymes which enhanced the loss of water soluble nitrogen with separated drip. Recently, Gandotra et al., (2012) attributed protein loss observed during frozen storage of (Labeo rohita) to the leaching effect on amino acid and watersoluble protein during thawing, process.
| Storage period (day) |
Fish Burger |
Fish Finger |
| Control |
SF |
MBP |
Control |
SF |
MBP |
| -15% |
-15% |
-20% |
-15% |
| 0 |
43.16 ± 0.092 |
41.91 ± 0.525 |
40.63 ± 0.363 |
50.76 ± 0.438 |
44.46 ± 0.256 |
43.15 ± 0.663 |
| 15 |
42.10 ± 0.635 |
40.41 ± 0.236 |
39.74 ± 0.427 |
49.75 ± 0.433 |
43.47 ± 0.271 |
41.77 ± 0.444 |
| 30 |
40.05 ± 0.606 |
39.35 ± 0.202 |
38.59 ± 0.311 |
45.93 ± 0.536 |
41.82 ± 0.273 |
39.36 ± 0.207 |
| 45 |
38.85 ± 0.490 |
37.19 ± 0.687 |
35.51 ± 0.871 |
43.41 ± 0.236 |
40.49 ± 0.282 |
37.09 ± 0.629 |
| 60 |
37.61 ± 0.352 |
35.22 ± 0.704 |
34.69 ± 0.398 |
42.26 ± 0.150 |
38.52 ± 0.300 |
35.02 ± 0.588 |
| 75 |
35.56 ± 1.15 |
32.59 ± 0.340 |
33.79 ± 0.456 |
40.76 ± 0.438 |
37.49 ± 0.282 |
33.13 ± 0.652 |
| 90 |
34.79 ± 0.577 |
31.10 ± 0.635 |
31.68 ± 0.975 |
38.51 ± 0.871 |
35.01 ± 0.583 |
31.64 ± 0.369 |
| Sig. |
0 |
0 |
0 |
0 |
0 |
0 |
Data are presented as mean ± SE of 3 replicates. –SE: standard error. -Significant difference at P<0.05.SF: Soybean flour, MBP: Minced boiled potato.
Table 4: Changes in protein content of sand smelt fish products during frozen storage at – 18°C.
Fat
Changes in fat content of fish burger and fingers during storage at -18 ?C for 90 days are showed in Table 5. All samples of burger and fingers showed a considerable decrease in their contents of fat during frozen storage and the decrease increased as the storage period prolonged. The initial fat contents of burger samples were 23.50, 19.08 and 16.67% (on dry weight basis) for control sample and those made by incorporation of 15% SF and 15% MBP, respectively. These values of fat content gradually decreased during frozen storage of the samples. Fat losses in control burger sample stored for 30, 60 and 90 days were estimated by 4.39, 11.96 and 19.96% respectively. However, the burger samples formulated with adding filling materials showed faster rates of fat decreasing during storage under the same conditions. In particular, burger sample formulated with adding 15% SF showed the highest decreasing in fat content among the different burger samples. The percentages of fat loss in 15% SF burger sample were calculated by 10.32, 19.23 and 29.19% after 30, 60 and 90 days of storage respectively, while after the same periods, burger sample contained 15% MBP lost about 4.5, 13.86 and 25.67% of their initial contents of fat. Similarly, the extend of fat decrease in fingers samples increased as storage period prolonged. Meanwhile, the rates of decreasing fat contents of fingers samples were found to be higher than those observed in burger samples stored under the same conditions. Moreover, it was observed that among the different analyzed samples, finger samples formulated with adding MBP showed the highest loss in fat contents during frozen storage. At the end of 90 days of frozen storage this sample lost more than 40%of its fat content. In a study made by Gandotra et al., (2012) on (Labeo rohita) fish during frozen storage for 21 days at -12 ± 2°C the losses in lipids concentration were determined by 5.44%, 15.80% and 22.27% after 7, 14 and 21 days of storage. Similar results reported by Fik, et al. (1988), Arannilewa, et al., (2005), Gomma, (2005) and Ibrahim and El-Sherif, (2008). The decreeing in fat content might be due to oxidation and hydrolysis of lipids which result in the formation of some volatile compounds as aldehydes and ketones. Same finding was mentioned by (Gandotra et al., 2012).
| Storage period (day) |
Fish Burger |
Fish Finger |
| Control |
SF |
MBP |
Control |
SF |
MBP |
| -15% |
-15% |
-20% |
-15% |
| 0 |
23.50 ± 0.288 |
19.08 ± 0.623 |
16.67 ± 0.352 |
16.61 ± 0.352 |
13.50 ± 0.288 |
13.27 ± 0.155 |
| 15 |
22.97 ± 0.560 |
17.61 ± 0.352 |
16.53 ± 0.306 |
15.88 ± 0.557 |
13.32 ± 0.184 |
13.11 ± 0.063 |
| 30 |
22.47 ± 0.271 |
17.11 ± 0.063 |
15.92 ± 0.531 |
14.95 ± 0.548 |
12.97 ± 0.560 |
12.41 ± 0.236 |
| 45 |
21.68 ± 0.392 |
16.33 ± 0.190 |
14.98 ± 0.277 |
13.78 ± 0.450 |
12.04 ± 0.023 |
11.24 ± 0.138 |
| 60 |
20.69 ± 0.173 |
15.41 ± 0.236 |
14.36 ± 0.207 |
13.21 ± 0.121 |
11.49 ± 0.282 |
10.55 ± 0.317 |
| 75 |
19.75 ± 0.433 |
14.50 ± 0.288 |
13.69 ± 0.398 |
12.37 ± 0.173 |
10.21 ± 0.121 |
9.83 ± 0.202 |
| 90 |
18.81 ± 0.178 |
13.51 ± 0.294 |
12.39 ± 0.225 |
11.69 ± 0.115 |
9.20 ± 0.057 |
7.91 ± 0.151 |
| Sig. |
0 |
0 |
0 |
0 |
0 |
0 |
Data are presented as mean ± SE of 3 replicates. –SE: standard error. -Significant difference at P < 0.05.SF: Soybean flour, MBP: Minced boiled potato.
Table 5: Changes in fat content of sand smelt fish products during frozen storage at – 18 ? C.
Ash
Table 6 shows the changes in ash contents of burger and fingers made from sand smelt fish during storage for 90 days. The general trend was increasing ash concentration in the different sample during storage. The results showed that ash content of control burger sample increased from 9.93% (on dry weight basis) at zero day of storage to 10.18, 11.34 and 11.49% after 30, 60 and 90 days of storage. Also, fish burger formulated by adding SF and MBP showed slight increases in their ash contents. In the same trend ash contents of fingers samples slightly increased during frozen storage. Similar observation was found during frozen storage of some fish products (Ibrahim and El-Sherif, 2008). Gomma (2005) reported that ash content of fish sausage made from catfish and Tilapia increased during storage at -18°C for 120 days. The increase in ash contents of fish products during frozen storage might be attributed to the loss recorded in the concentration of protein and fat content which reflected the increasing found in ash contents. On the other hand some studies showed a decreasing in ash content of fish during frozen storage which was attributed to the drip loss during thawing process (Gandtora et al., 2012).
| Storage period (day) |
Fish Burger |
Fish Finger |
| Control |
SF |
MBP |
Control |
SF |
MBP |
| -15% |
-15% |
-20% |
-15% |
| 0 |
9.93 ± 0.536 |
12.60 ± 0.346 |
10.06 ± 0.323 |
9.23 ± 0.132 |
9.63 ± 0.288 |
7.68 ± 0.392 |
| 15 |
9.93 ± 0.288 |
12.43 ± 0.248 |
10.10 ± 0.404 |
9.47 ± 0.277 |
9.96 ± 0.554 |
8.01 ± 0.583 |
| 30 |
10.18 ± 0.103 |
12.59 ± 0.340 |
10.19 ± 0.109 |
9.40 ± 0.230 |
9.93 ± 0.479 |
8.26 ± 0.150 |
| 45 |
10.14 ± 0.080 |
13.36 ± 0.207 |
10.57 ± 0.309 |
9.53 ± 0.288 |
10.38 ± 0.219 |
8.26 ± 0.080 |
| 60 |
11.34 ± 0.023 |
13.78 ± 0.115 |
11.33 ± 0.190 |
10.35 ± 0.202 |
10.60 ± 0.346 |
8.63 ± 0.132 |
| 75 |
11.27 ± 0.155 |
14.04 ± 0.173 |
11.73 ± 0.132 |
10.35 ± 0.202 |
10.93 ± 0.288 |
9.08 ± 0.623 |
| 90 |
11.49 ± 0.051 |
13.85 ± 0.086 |
11.78 ± 0.115 |
10.46 ± 0.265 |
11.85 ± 0.202 |
10.01 ± 0.288 |
| Sig. |
0 |
0.001 |
0 |
0.005 |
0.011 |
0.013 |
Data are presented as mean ± SE of 3 replicates. –SE: standard error. -Significant difference at P < 0.05.SF: Soybean flour, MBP: Minced boiled potato.
Table 6: Changes in ash content of sand smelt fish products during frozen storage at – 18 ? C.
Carbohydrate
The remaining percentage of the chemical composition of a given food products is likely to be the carbohydrate. The carbohydrate of sand smelt fish products during frozen storage were calculated using the difference methods and data obtained are presented in Table 7. Chemical composition of fish burger showed that the carbohydrate contents of control sample was 23.41% (on dry weight basis), while samples formulated with incorporation of SF and MBP contained 26.41 and 32.64% (on dry weight basis), respectively. Carbohydrate contents of control and formulated burger samples gradually increased during frozen storage. At the end of 90 days of storage carbohydrate contents of control and 15% SF and 15% MBP formulated sample were calculated by 34.91, 41.54 and 44.16 % (on dry weight basis), respectively. Similarly, fish finger samples showed the same trend regarding the changes in carbohydrate during storage under the same condition. Carbohydrate contents of control, 20% SF, 15% MBP increased from 23.40, 32.53 and 35.90%, respectively at zero time to 39.34, 43.94and 50.44% at the end of 90 days storage. The result obtained in the present study agreed with those reported by (Gomma 2005). This increase in carbohydrate contents of fish products may be due to the decrease occurred in moisture, protein and fat contents during frozen storage.
| Storage period (day) |
Fish Burger |
Fish Finger |
| Control |
SF |
MBP |
Control |
SF |
MBP |
| -15% |
-15% |
-20% |
-15% |
| 0 |
23.41 ± 0.236 |
26.41 ± 0.814 |
32.64 ± 0.369 |
23.40 ± 0.230 |
32.53 ± 0.306 |
35.90 ± 0.519 |
| 15 |
25.00 ± 0.577 |
29.55 ± 0.317 |
33.63 ± 0.363 |
24.90 ± 0.519 |
33.24 ± 0.138 |
37.12 ± 0.646 |
| 30 |
27.30 ± 0.173 |
30.94 ± 0.542 |
35.30 ± 0.173 |
29.72 ± 0.415 |
35.28 ± 0.161 |
39.97 ± 1.47 |
| 45 |
29.32 ± 0.184 |
33.12 ± 0.646 |
38.94 ± 0.542 |
33.28 ± 0.161 |
37.07 ± 0.617 |
43.41 ± 0.236 |
| 60 |
30.22 ± 0.127 |
35.59 ± 0.340 |
39.63 ± 0.363 |
34.17 ± 0.675 |
39.39 ± 0.225 |
45.81 ± 0.467 |
| 75 |
33.41 ± 0.236 |
38.87 ± 0.502 |
40.79 ± 0.456 |
36.52 ± 0.300 |
41.36 ± 0.207 |
47.96 ± 0.554 |
| 90 |
34.91 ± 0.525 |
41.54 ± 0.311 |
44.16 ± 0.669 |
39.34 ± 0.196 |
43.94 ± 0.542 |
50.44 ± 0.282 |
| Sig. |
0 |
0 |
0 |
0 |
0 |
0 |
Data are presented as mean ± SE of 3 replicates. –SE: standard error. -Significant difference at P < 0.05.SF: Soybean flour, MBP: Minced boiled potato.
Table 7: Changes in carbohydrate content of sand smelt fish products during frozen storage at – 18 ? C.
Cooking loss
Cooking loss is an important criterion since it represents economic loss, alteration of nutritional value of the product due to releasing some of the soluble nutrients such as vitamins and amino acids and also negatively affects the texture of the cooked product. In the present study, cooking losses were determined in sand smelt fish products immediately after processing (before storage) and periodically during frozen storage. After frying the product in vegetable oil (sun flower oil). As shown in Table 8, the initial values of cooking of control, 15% SF and 15% MBP burger samples were 26.01, 17.87 and 20.35%, respectively. Also, cooking loss values for control, 20% SF and 15% MBP finger samples before storage were respectively; 17.17, 12.96 and 16.38%. These observations show that burger and finger samples prepared from sand smelt fish by formulation with the filling materials SF and MBP had the lower values of cooking loss when compared with control samples of the two products. It could be concluded that the filling materials particularly soy bean flour (SF) had an improving effect in minimizing the cooking loss, consequently, reducing the undesirable changes in the cooking characteristics of sand smelt fish products. Cooking process by frying is usually accompanied by moisture loss by evaporation and fat absorption by the product. The effect of filling materials in lowering the cooking loss may be explained by their characteristics in retarding water loss and increasing oil absorption. Some other filling materials such as artichokes, burg hut, potato and plant flours showed similar lowering effect on cooking loss in fish products (Ibrahim, 2004; El-sherif, 2007 and Izci, 2010). Data given in Table 8 show storage changes in cooking loss in sand smelt fish burger and finger during storage for 90 days at -18°C. No considerable changes in cooking loss could be observed in the early stages of frozen storage. Meanwhile, as the storage period prolonged, cooking loss values increased. Cooking loss values of control, 15% SF and 15% MBP burger samples increased from 26.01, 17.87 and 20.35% at zero time to 27.68, 20.61 and 23.44% after 90 days frozen storage. Under the same conditions of storage the initial values of cooking loss in control, 20% SF and 15% MBP finger samples increased from 17.17, 12.96 and 16.38% to 19.63, 14.82 19.13% after 90 days storage, respectively. We found no previous research about changes in cooking characteristics of fish products during storage.
| Storage period (day) |
Fish Burger |
Fish Finger |
| Control |
SF |
MBP |
Control |
SF |
MBP |
| -15% |
-15% |
-20% |
-15% |
| 0 |
26.01 ± 0.577 |
17.87 ± 0.502 |
20.35 ± 0.202 |
17.17 ± 0.081 |
12.96 ± 0.554 |
16.38 ± 0.219 |
| 15 |
26.03 ± 0.306 |
18.07 ± 0.404 |
21.32 ± 0.184 |
18.01 ± 0.346 |
13.25 ± 0.144 |
16.50 ± 0.288 |
| 30 |
26.17 ± 0.658 |
18.63 ± 0.363 |
21.40 ± 0.230 |
18.42 ± 0.242 |
13.32 ± 0.184 |
16.97 ± 0.173 |
| 45 |
26.20 ± 0.692 |
19.05 ± 0.606 |
22.54 ± 0.311 |
18.43 ± 0.248 |
13.84 ± 0.484 |
17.13 ± 0.075 |
| 60 |
27.20 ± 0.115 |
19.60 ± 0.346 |
22.82 ± 0.437 |
18.67 ± 0.386 |
13.90 ± 0.519 |
18.03 ± 0.297 |
| 75 |
27.52 ± 300 |
19.65 ± 0.375 |
22.84 ± 0.484 |
19.25 ± 0.144 |
14.77 ± 0.444 |
18.23 ± 0.162 |
| 90 |
27.68 ± 0.487 |
20.61 ± 0.352 |
23.44 ± 0.254 |
19.63 ± 0.363 |
14.82 ± 0.473 |
19.13 ± 0.652 |
| Sig. |
0.107 |
0.006 |
0 |
0.001 |
0.046 |
0 |
Data are presented as mean ± SE of 3 replicates. –SE: standard error. -Significant difference at P<0.05.SF: Soybean flour, MBP: Minced boiled potato.
Table 8: Changes in cooking loss% of sand smelt fish products during frozen storage at – 18°C.
Conclusion
Sand smelt fish burger and finger considered as good source for protein, fat, ash and carbohydrates. The substitution material (soybean flour (SF) and minced boiled potatoes (MBP)) was used by different levels in this investigation were improved the chemical composition of produced fish products. During frozen storage, No considerable changes in chemical composition and cooking loss of sand smelt fish burger and fingers. At the end of 90 days frozen storage period sand smelt fish products had a good chemical composition.
24196
References
- A.O.A.C. (2012) Association of official analytical chemists. Official methods of analysis. 19th edition, suite 500, 481 north Frederick Avenue, Gaithersburg, Maryland, 20877-2417, USA.
- Abo-Taleb, M. (1997) Studies on the utilization of Carp fish in some fishery products. Ph.D. Thesis, Fac. of Agric., Ain Shams Univ.Cairo, Egypt.
- Abo-Zeid, K.S.S. (1995) Chemical and histological studies on carp fish preserved at low temperature. M.Sc. Thesis, Fac. of Agric., Cairo Univ., ARE.
- Altun, O. (1999) Morphological Variations Observed in Sand Smelt (Atherina boyeri Risso, 1810). Populations Trend J Zool 23; 911-918.
- Arannilewa, S.T., Salawn, S.O., Sorungbe, A.A., Ola-Salawn (2005) Effect of frozen period on the chemical, microbiological, and sensory quality of frozen Tilapia fish (Sarotherodun galiaenus). African J of Biotechnol 4; 852-855.
- Baaiu, M.M. (1974) Technological studies on the processing of some varieties of fish species. M.Sc. Thesis, Fac. of Agric., Ain-Shams Univ., ARE.
- Benjakul, S., Visessanguan, W., Thongkaew, C., Tanaka, M. (2005) Effect of frozen storage on chemical and gel forming properties of fish commonly used for surimi production in Thailand. Food hydrocolloids 19; 197-207.
- Çakli. S., Taskaya, L., Kisla, D., Çelik. U., Ataman, C.A., et al., (2005) Production and quality of fish finger from different fish species. Eur. Food Res. Technol. 220: 526-530.
- Çakli, S., Taskaya, L., Kisla, D., Çelik, U., Ataman, C.A., et al., (2005) Production and quality of fish finger from different fish species. Eur Food Res Technol 220; 526-530.
- Chandrasckhar, T.C., Mohite, R.R. (1978): Effect of fat coated sorbic acid (ECSA) and the shelf life of fish sausage stored at 10oC and ambient temperature. J. Sea Food Export 10; 19-23.
- El-Akeel, A.T.M. (1983) The effect of processing and storage on fish quality. M. Sc. Thesis, Fac. of Agric., Cairo Univ.
- El-Sherif, S.A. (2007) Evaluation of fish cakes processed from bassaria fish (Atherina hepsetia) J. Agric. Sci. Mansoura Univ 32; 2071-2083.
- Fik, M.K. Surowka, Leszeynska, A. (1988) Application of super chilling to prolong the keeping time of rainbow trout. Nearing, 32; 291-300.
- Gandotra, R., Koul, M., Gupta, S., Sharma, S. (2012) Change In Proximate Composition And Microbial Count By Low Temperature Preservation In Fish Muscle of Labeo Rohita (Ham-Buch). IOSR Journal of Pharmacy and Biological Sciences (IOSRJPBS) 2; 13-17
- Gokoglu, N., Yerlikaya, P. (2015) Seafood Chilling, Refrigeration and Freezing: Science and Technology. Chapter 7 Freezing technology p: 163-185.
- Gomma, R. A. M. (2005) Studies on producing sausage from some fish types. M.Sc. Thesis, Fac.of Agric. Al-Azher Uni., Egypt.
- Hui, Y.H. (2007) General food quality factors . In: Nollet, L.M.L. (ed.) Handbook of Meat, Poultry and Seafood Quality. Blackwell Publishing.
- Ibrahim, S.M. (2004) Quality assessment of carp fish (cyprinus carpio l.) cakes. Minufiya J. Agric. Res., 29: 913-924.
- Ibrahim, S.M., El-Sherif, S.A. (2008) Effect of some plant extracts on quality aspects of frozen Tilapia (Oreachromis niloticus L.) Global Veterinaria 2; 62-66.
- Izci, L. (2010) Utilization and quality of fish fingers from Prussian Carp (Carassius gibelio Bloch,1782). Pak Vet J 30; 207-210.
- Kocatepe, D., Turan, H., Ta?kaya, G., Kaya, Y., Erden, R., et al. (2011) Effects of cooking methods on the proximate composition of black sea Anchovy (Engraulis encrasicolus, Linnaeus 1758). GIDA (2011) 36; 71-75.
- Merrill, A.L., Watt, B.K. (1973) Energy Value of Foods: Basis and Derivation. Agriculture Handbook. US Department of Agriculture, Agricultural Research Service, Washington DC.
- Orban, E., Di Lena, G., Nevigato, T., Casini, I., Santaroni, G., et al. (2002) Quality characteristics of sea bass intensively reared and from lagoon as affected by growth conditions and the aquatic environment. J. Food Sci 67; 542-546.
- Roland, L.M., Sedemman, S.C., Donnely, L.S., Quenzer N.M. (1981) Physical sensory properties of chicken patties made with varying proportion of white and dark spent fowle muscle. J Food Sci 46; 834.
- Tokur, B., Ozkutuk, S., At?c?, E., Ozyurt, G., Ozyurt, C.E. (2006) Chemical and sensory quality changes of fish fingers made from mirror carp (Cyprinus carpio L., 1758) during frozen storage (-18 ºC). Food Chem 99; 335-341.
- Venugopal, V. and Shahidi, F. (1995) Value added products from underutilized fish species. Food Science and Nutrition 35; 431-453.
- Xiong, Y. L. (1997): Protein denaturation and functionality losses. In Quality in Frozen Food M. C. Erickson, & Y. C. Huang (Eds.),. New York: Chapman & Hall 111-140.
- Zamir, M., Qasim, R., Ullah, A. (1998) Changes in physical and chemical constituents of crab meat during storage at refrigerator temperature (7±2°C). Pak J of Pharma Sci 11; 27-33.


